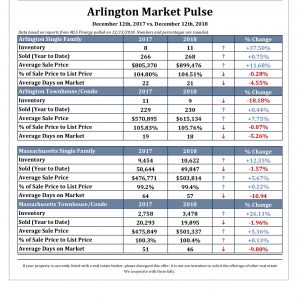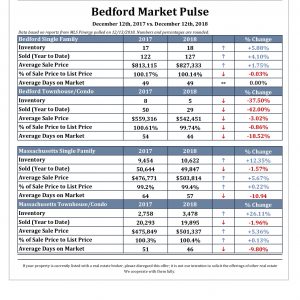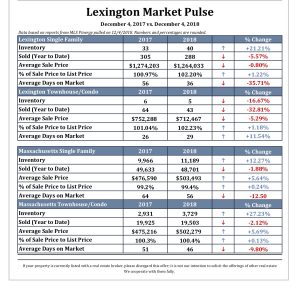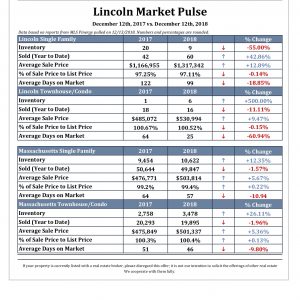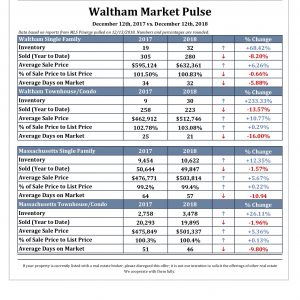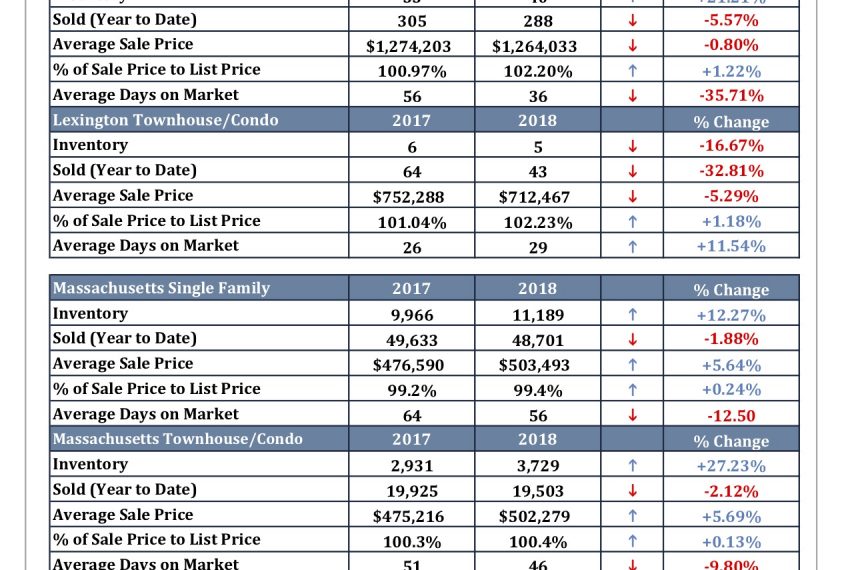
It’s a good time of year in the real estate calendar to reflect on market conditions. Looking at the below reports (click to enlarge any of them), some of the standout numbers for single family home sales:
- Inventory in Massachusetts statewide is up 12.35% over the 12th of December last year. Closed sales were down year to date 1.5% but average sale price was up 5.67%
- Looking at some of the towns in which we do most of our business, Lexington inventory is up 21.21%, 40 houses versus the 33 on the market last year at this time. The number of closed sales is down 5.57%. Average price more or less remained flat, at +.80%. Median price of closed sales, however (not shown in the charts) dropped about 8% from $1.268 million in 2017 to $1.171 million in 2018. Average days on market is down 35.71, from 56 to 36. The median price of the available 40 properties is $2,224,500. 21 houses are priced above $2 million at the moment. There were 27 sales above $2 million in the past 12 months. That leaves us with 9.33 months of available inventory in that range versus only .63 months of inventory below $2 million.
- Lincoln inventory is down 55%, from 20 houses last year to nine at the moment. Sales were up 42.68% and average price was up 12.29%. The average days on market is down from 122 to 99.
- Inventory is up in Arlington by 37.5% but that is only 11 houses this year versus eight this time last year. Number of sales remained mostly flat, up .75%. Average price was up 11.68%. Days on market was flat, 21 in 2017 compared to 22 this year.
- Things were looking up in Bedford. Inventory is up 5.88% (a difference of only one unit, though, 18 over 17 houses last year). Sales were up 4.1%. Prices were up 1.75%. Days on market stayed exactly the same at 49.
- Waltham is interesting. Inventory is up 68% (32 versus 19 houses last year). Sales were down by 8.2%. But the average price is up 12.89%. Median price was up about 5%, from $582,000 to $610,000.
- Arlington
- Bedford
- Lexington
- Lincoln
- Waltham
Setting aside speculation about macroeconomic trends in the country (many predictions are of a softening if not an actual recession in 2019), all of these sample towns aside from Lincoln show an increase in inventory. We are looking at December 2017 over same month this year. Single family house inventory in this region of the state generally is at its lowest around January, picks up a bit through February and March, hits a high point in June, dips slightly as the spring market gets absorbed, and then hits a peak in October. The homes that are on in the fall are usually a combination of leftover inventory (meaning it was overpriced and/or at the rarefied high end with a tiny available buyer pool) and sellers who are relocating or just waited out or just were not prepared in time for the previous spring/summer market. Using Lexington in 2018 as an example, right now there are 36 houses that have on the market for an average of 119 days. In June there were 52 houses on for an average of 69 days on market.*
Very important to note is that January 2018 was the lowest point for statewide home inventory in many years, if not decades. So this increase in inventory does not necessarily herald anything other than a slow return to normalcy. But either way, it is better news for potential buyers. The winter months are really a reset for the housing market around here. Spring will tell the tale.
Anecdotally, looking at Lexington, developers have been bullish about the luxury market, as most of those $2 million-plus homes are new construction. Most of the lots were acquired as tear-downs between $700k-900k, a substantial investment with a potentially high return. But compared to the rest of the market, that tier represents a buyer’s market.
Lincoln is a small market and so a small sample size (44 sales in 2017 and 62 this year). But it has been a particularly good year for sellers there. The median sales price this year was $1,155,000, also an increase from $1,072,500 in 2017.
Our team has been busier compared to this time last year. We only had a couple of listings come on in September through the end of 2017. But this year we brought on four during that time and have had four go under agreement. It appears we have more listings signed up for 2019 than we had at a similar point last year. In the past 12 months the Janovitz + Tse Team had 21 closed listings and sales in multiple towns and price ranges. They sold on average of 103% of their original list prices and 104% after price drops. They were on the market an average of 19 days.
The team has closed $361,655,851 in gross sales in 488 transactions since 2001.**
*You will note in this example our numbers are different than those provided in the chart below, which was run for me by someone in my office and is dated December 12. We are looking at MLS today and this latest snapshot it what we see at the time of writing.
**Individually and starting around 2006 as a team
